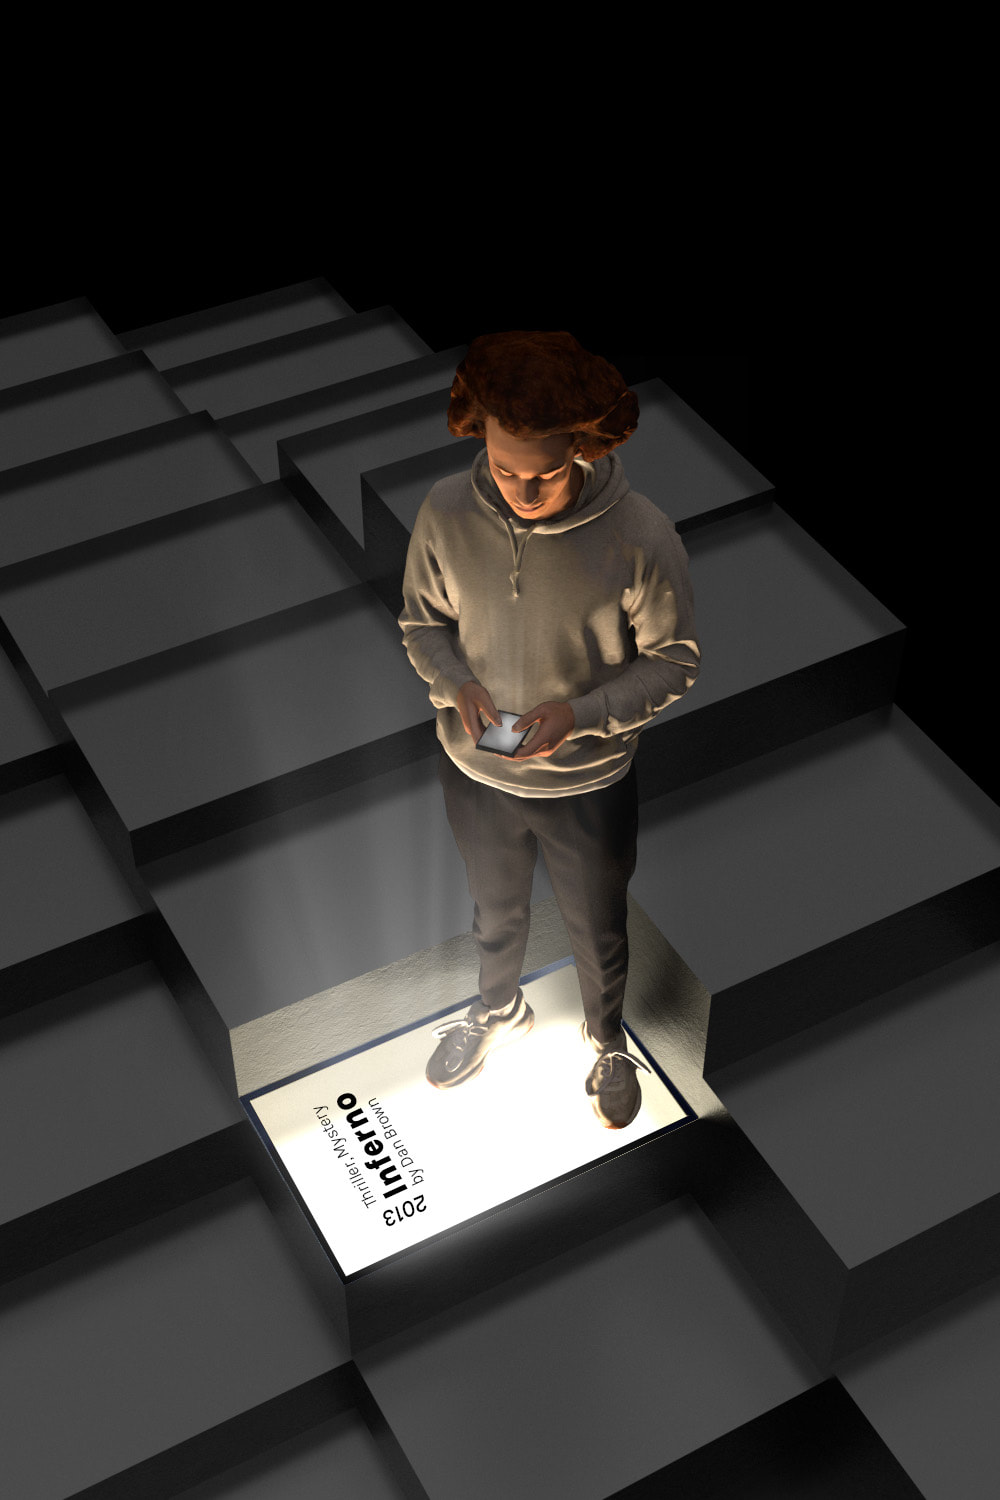
STATISTICAL INTERACTION
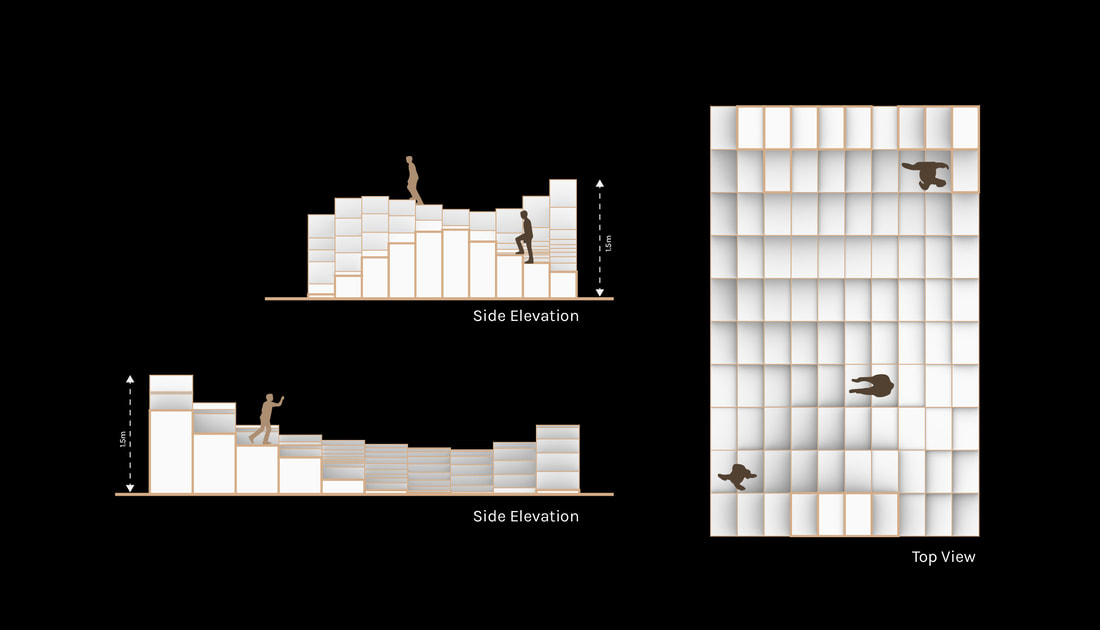
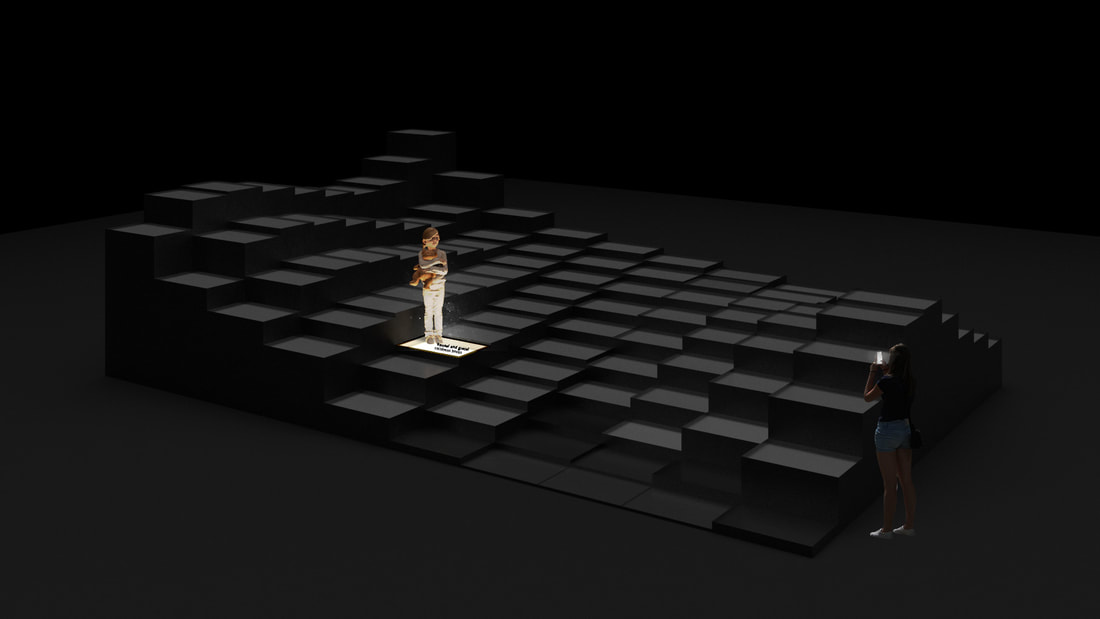
This one-week group project looked at the use of grasshopper scripting to visualize library statistical data. The result was an interactive sculpture which used digital and physical publishing rates to create platforms. These platforms encourage user engagement and when touched, recommend resources and books within the library. The design used the literacy rates of geographical areas to create unique iterations and ensure the design could be used in a variety of library locations.